Contents
-
Input Files
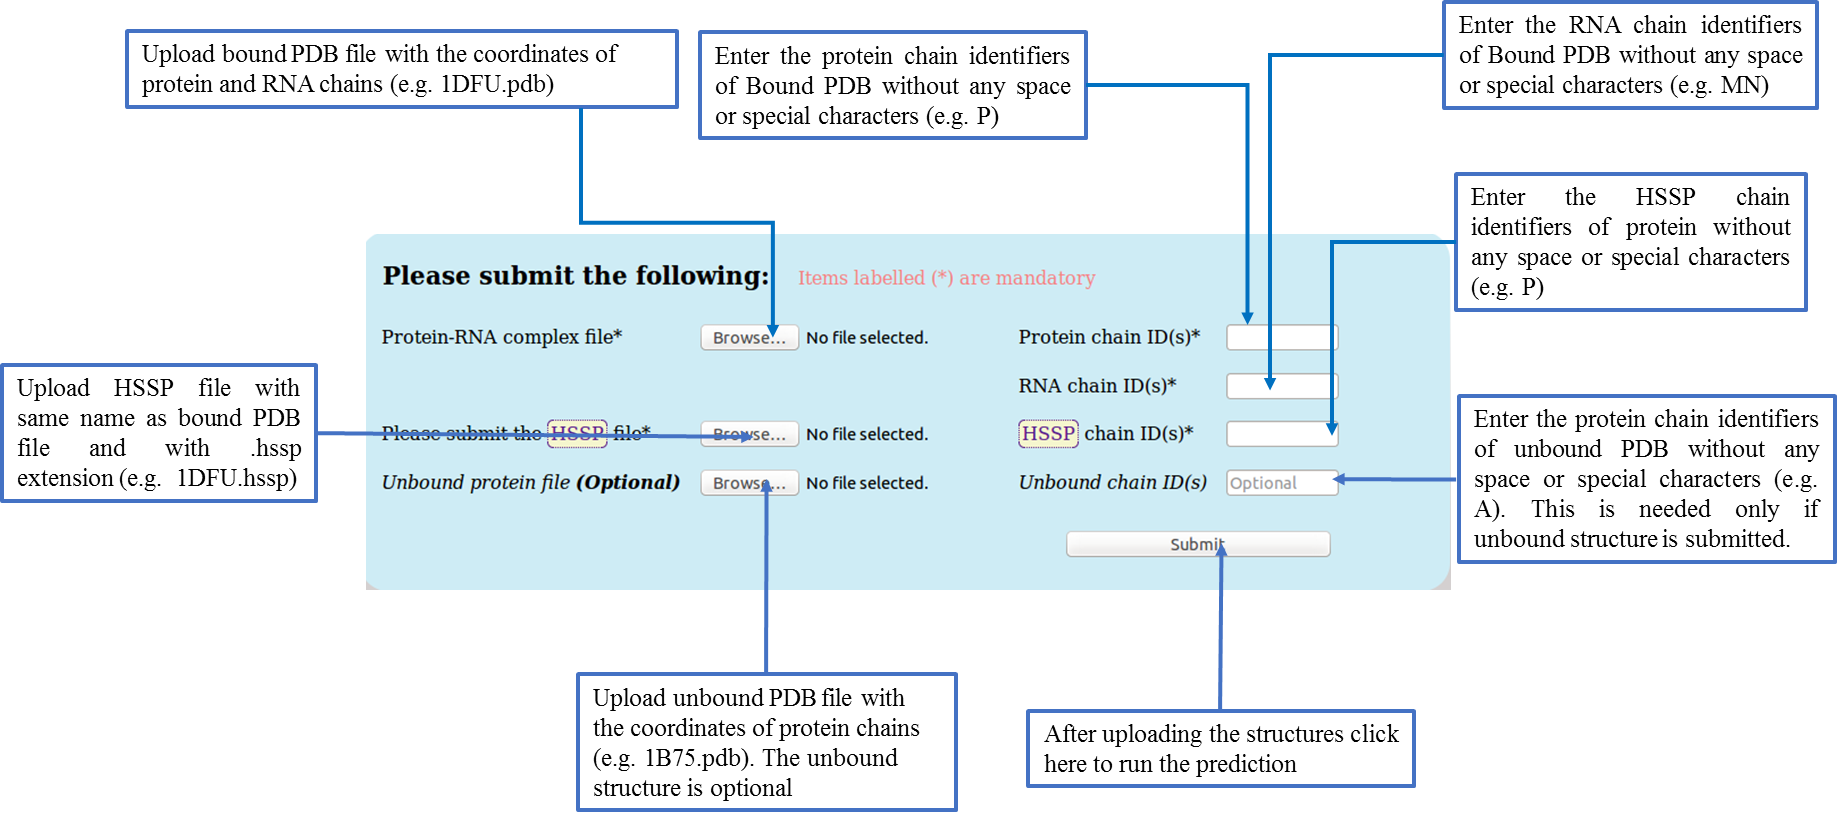
User need to submit the following files:
Users must upload a protein-RNA complex file containing the atomic coordinates of protein and RNA chains in one single file in the Protein Data Bank format (.pdb). (http://www.rcsb.org/). The multiple sequence alignments of the protein subunit of the above protein-RNA complex in HSSP (Homology-Derived Secondary Structure of Proteins) format (.hssp). The alignment file can be downloaded from the HSSP database: http://mrs.cmbi.ru.nl/. The user need to select the HSSP dataset available at this url and search for the PDB ID of bound structure. Along with these two files, users need to submit the chain identifier(s) of the protein and RNA subunits (maximum 8 chain identifiers) of the protein-RNA complex. Also, the chain identifier present in the .hssp file should be provided by the users.
The program generally takes 10 seconds to print the output data for an average size protein-RNA complex. The programs can handle up to eight protein chains and eight RNA chains with a maximum limit of 20,000 amino acids and 20,000 nucleotides respectively.
Go to Top
[Go Back to application] -
Output files
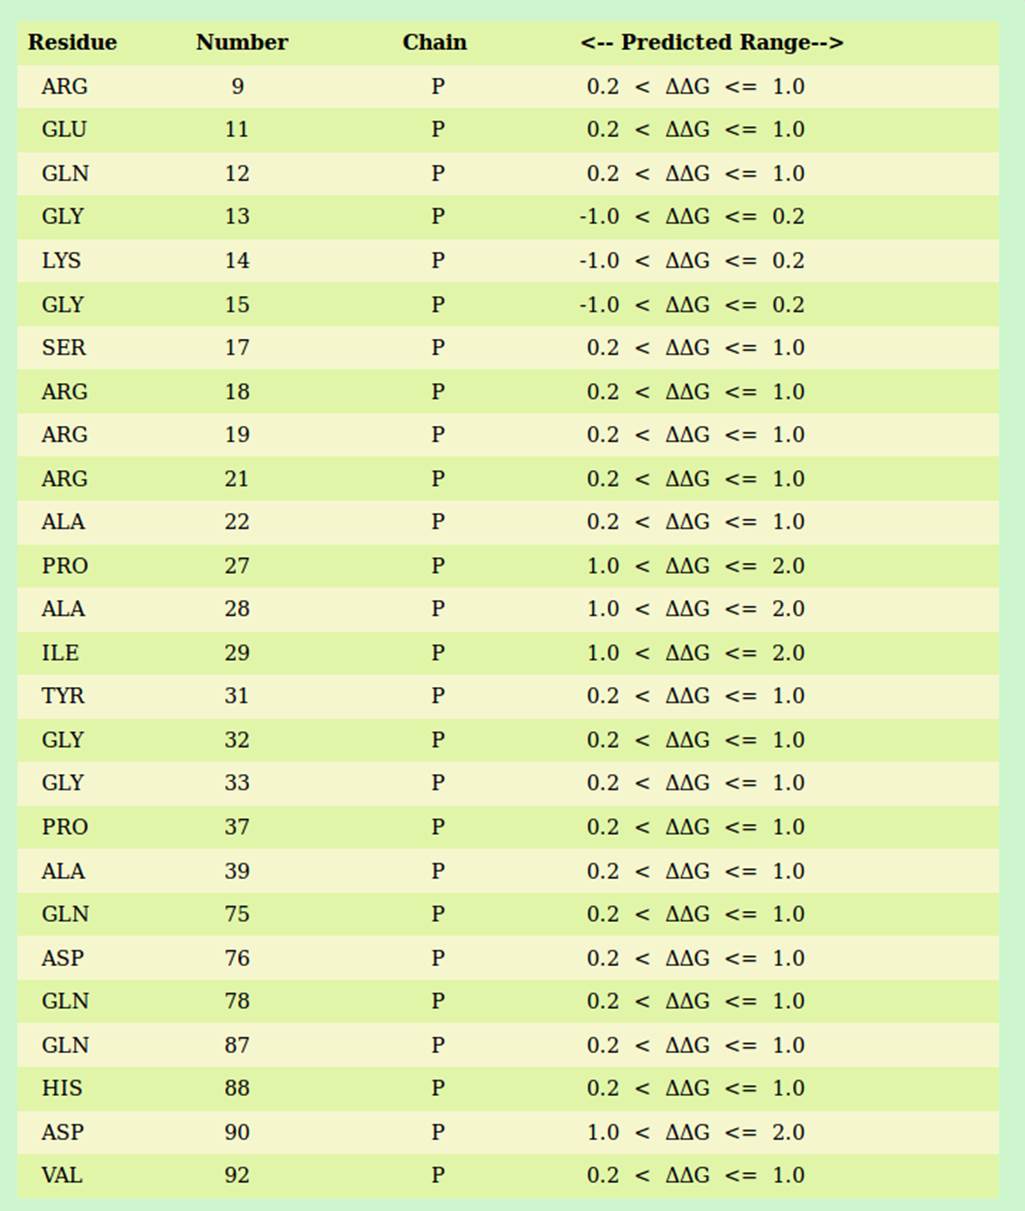
The program generates a single output file named “PDBid.pred” (example 1dfu.pred) consisting the list of the interface protein residues of the submitted protein-RNA complex. The output file provides the following information with each column separated by a tab and can be downloaded by the users. A typical example (from 1DFU.pdb) of output parameters is shown in the Table below:
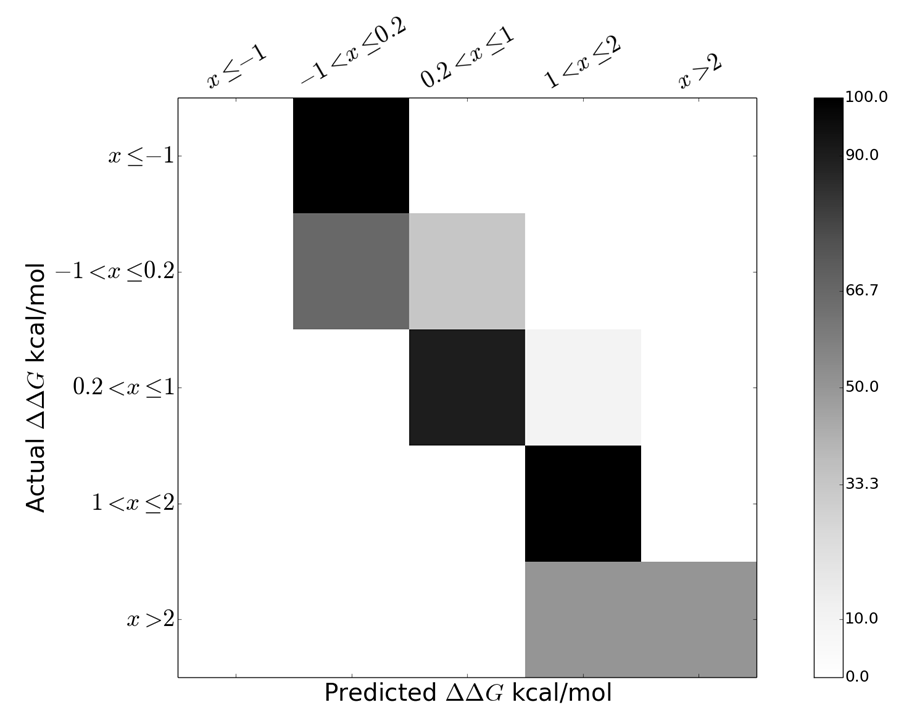
We used Random Forest (RF) to predict the class of a ΔΔG by using the structural and physicochemical attributes of the interface. To predict the class of ΔΔG for a given mutation, we have developed a model using RF implemented in Scikit-learn version 0.15, a module in Python programming language. We obtained prediction accuracy of 80% as shown in the confusion matrix shown in figure below.
Go to Top
[Go Back to application] -
The following parameters were used to train the model:
-
Interface area:
The protein-RNA interface is defined as a set of amino acid residues and nucleotides that losses Solvent Accessible Surface Area (SASA) in complexation. The SASA is calculated by using the program NACCESS (Hubbard 1992). The interior of the protein comprises of those residues that are completely buried inside the protein and have relative SASA ≤ 5%. The relative SASA is calculated by taking the ratio of the SASA in the complex to the SASA in the extended conformation in Ala-X-Ala form, where X is the residue of concern. Residues that are not part of the interface or the protein interior are assigned as surface residues.
Go to Top
[Go Back to application] -
Hydrogen bonds:
Hydrogen bonds (H-bonds) between protein and RNA groups were identified with program HBPLUS (McDonald & Thornton, 1994) using default parameters. The total number of H-bonds made by a residue irrespective being donor or acceptor is given in the output file.
Go to Top
[Go Back to application] -
Shannon Entropy:
Shannon entropy was used to characterize the residue variability at each sequence position of a set of aligned amino acid sequences. If nk of the N aligned sequences have an amino acid residue of type k at position i, the frequency of type k is pk= nk / N, and the sequence entropy is given as:
In the current implementation, the summation is made over 21 residue types, where the type 21 is a gap in the alignment. The entropy Si varies between 0.0 at positions that are fully conserved, and ln 21 ~ 3.0, at positions where all 21 types are equally represented in the aligned sequences. In general, Si depends on the number (N) of aligned sequences and their overall divergence. To correct that dependency, normalized entropies were calculated as:

where
Go to Top is the mean value of Si taken over the entire polypeptide chain.
[Go Back to application] -
Salt Bridges:
The salt bridges at protein-RNA interfaces were calculated when the distance between the side chain nitrogen atoms of positively charged residues and the negatively charged phosphate group of the nucleotides is within 4 Å (Barlow & Thornton, 1983; Xu, Tsai, & Nussinov, 1997).
Go to Top
[Go Back to application] -
Local density:
Local atomic density (LD) index is used to measure the overall density of the interface as described by Bahadur et al., (2004). In brief, for each interface atom i, the number ni of the interface atoms that were within a distance 12 Å of atom i in the same subunit was counted. LD is the average of ni over all N interface atoms and is given by the following equation:
Go to Top
[Go Back to application] -
Stacking interactions:
Stacking interactions at protein-RNA interfaces are usually defined as the Π-Π interactions that can occur between the side chains of Tyr, Trp, Phe, His and the RNA bases. Moreover, the Π-Π and Π-cation stacking of Arg through its guanidinium moiety onto nucleosides were included in the calculation of stacking interactions (Allers & Shamoo, 2001). We defined the planes at both sides by considering the atoms constituting the aromatic rings, and the center of the plane was calculated as the mid-point of all these atoms. The cut-off distance between the centers of both the planes was kept ≤ 5Å , and the dihedral angle between the two planes was constrained to ≤ 30Å (Allers & Shamoo, 2001). The stagger angle is defined as the angle between the normal to the first plane and the vector joining the centers of the two planes.
Go to Top
[Go Back to application] -
Amino acid classification:
The amino acids were classified following the scheme given below
Hydrophobic: ILE, VAL, LEU, PHE, CYS, MET, ALA.
Hydrophilic: GLY, SER, THR, TYR, TRP, PRO, HIS, ASN, GLN.
Positive: ARG, LYS.
Negative: ASP, GLU.
Go to Top
[Go Back to application] -
ΔASA
The ΔASA is defined as the difference in SASA between the conformations of protein before and after binding. The conformation before binding is obtained from the unbound PDB while the conformation after binding is obtained by separating the protein chain(s) from bound structure. NACCESS is used to calculate the SASA of both conformations and there by ΔASA is derived.
Go to Top
[Go Back to application] -
Cα-RMSD
The Cα-rmsd is the root mean squared displacement of Cα atoms calculated by superposing the unbound and the bound structures. The unbound structure is obtained by performing sequence similarity search the PDB. The PDB structures having only the protein structure crystallized in the free form is termed as the unbound structure. The unbound structure is obtained by isolating the protein chains from the bound structure and performing a BLAST search with the PDB database. The free form structure with more than 75% similarity are selected. If there are more than one structure available then the one with maximum query coverage, best resolution and minimum number of missing residues are selected. The bound and unbound structures are superposed using PHENIX program and the rmsd values are calculated. The c-rmsd is calculated for the Cα atoms of interface residues using the superposed coordinates. For two points, v and w, the root mean square deviation (RMSD) is defined by the following equation:
Go to Top
[Go Back to application]
-